Visual allocation of your crypto portfolio assets
Immediately visualize your portfolio composition through clear allocation reading. Identify crypto and cash allocations at a glance.
The problem
When multiple portfolios, wallets, or accounts are tracked in parallel, it becomes difficult to quickly evaluate the real asset distribution without going through calculations or multiple views.
CIYL's response
The visual asset allocation transforms allocations into immediate graphical reading. You clearly visualize the crypto portion, cash portion, and overall portfolio balance.
A visual reading of allocation at a glance
A synthetic view designed to immediately understand how assets are distributed, without having to browse multiple tables or reprocess data.

See portfolio structure effortlessly
A visual representation allows understanding the portfolio's overall balance much faster than a simple list of amounts.
What is visual asset allocation for?
This feature provides synthetic and graphical reading of a portfolio's composition to better manage allocation balances and make information more immediately usable.
- Visualize crypto and cash portions at a glance
- Quickly understand the portfolio's overall balance
- Make reading easier for both manager and client
- Make allocations more visually readable
- Support clearer exposure tracking
Why this feature is essential
Immediate reading
The distribution is instantly understood without interpreting a complex table.
Better allocation readability
The graphical representation makes the balance between different pockets much clearer.
Management support
Better visual reading helps track exposures and adjust portfolio structure more easily.
Simplified communication
Portfolio composition becomes easier to explain and share with a client or partner.
What the manager visualizes concretely
Essential composition indicators
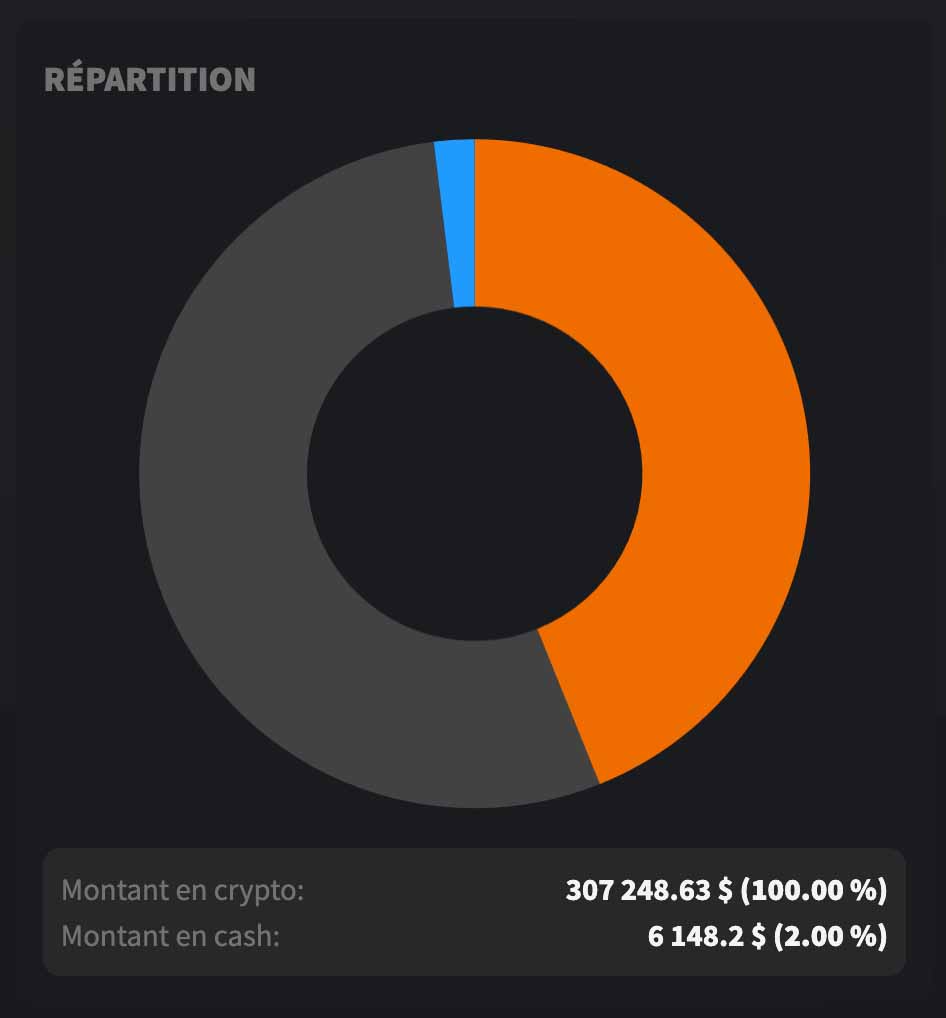
The view combines graphical representation, amounts, and percentages to provide complete but immediate reading of portfolio structure.
- Distribution between crypto and cash
- Amounts allocated per pocket
- Composition percentages
- Instant visual reading
- Clearer communication support
Readable allocation becomes easier to manage
The easier a portfolio is to read, the smoother daily tracking and client exchanges become.
Typical use cases

Family office
Clear client allocation reading - Quickly understand a portfolio's overall structure without detailed line-by-line analysis.

Manager
More readable exposure tracking - Quickly check balance between allocation pockets and maintain clear exposure vision.

Reporting
More intuitive composition presentation - Support exchanges with clear graphical representation of portfolio allocation.
Complementary features
Combine allocation visualization with other tracking and sharing tools for optimal management.


FAQ
What exactly does visual asset allocation show?
It shows portfolio composition in graphical form, with amounts and percentages associated with different pockets, such as crypto portion and cash portion.
Why use a visual view rather than a table?
Because a visual representation allows understanding overall balance and portfolio structure much more quickly.
Does this feature help with client reporting?
Yes. It makes portfolio composition simpler to read, explain, and share.
Is the displayed allocation useful for daily tracking?
Yes. It provides quick allocation view and facilitates portfolio balance control.
Visualize your allocations more clearly
- Instantly visualize your portfolio composition
- Quickly identify crypto / cash distribution
- Communicate more easily with your clients
- Manage your exposures with clear vision